Sharing Dashboards
Overview
The MCP enables users to convert any LLM-generated analysis into a live, interactive dashboard hosted on Central Monitoring. When you ask your LLM to summarise data - error trends, workload failures, ticket volumes - you can then use a tool to create a shareable dashboard from that analysis. The result is a live-updating, hosted HTML page with a unique URL that you can share with users and teams.
End users of the dashboard will still need Central Monitoring API credentials.
How It Works
- Query your data: Ask the LLM a question using the CM MCP tools (e.g. "How many tickets were raised this week, grouped by severity?").
- Request a dashboard: Once the LLM has responded, ask it to build a dashboard from the results (e.g. "Create a dashboard analysing this data"). Iterate on the layout and content until you're happy with it.
- Attach the dashboard prompt: Attach the provided prompt that instructs the LLM how to generate a live, hosted dashboard.
- Claude: Add the prompt via the attachment menu:
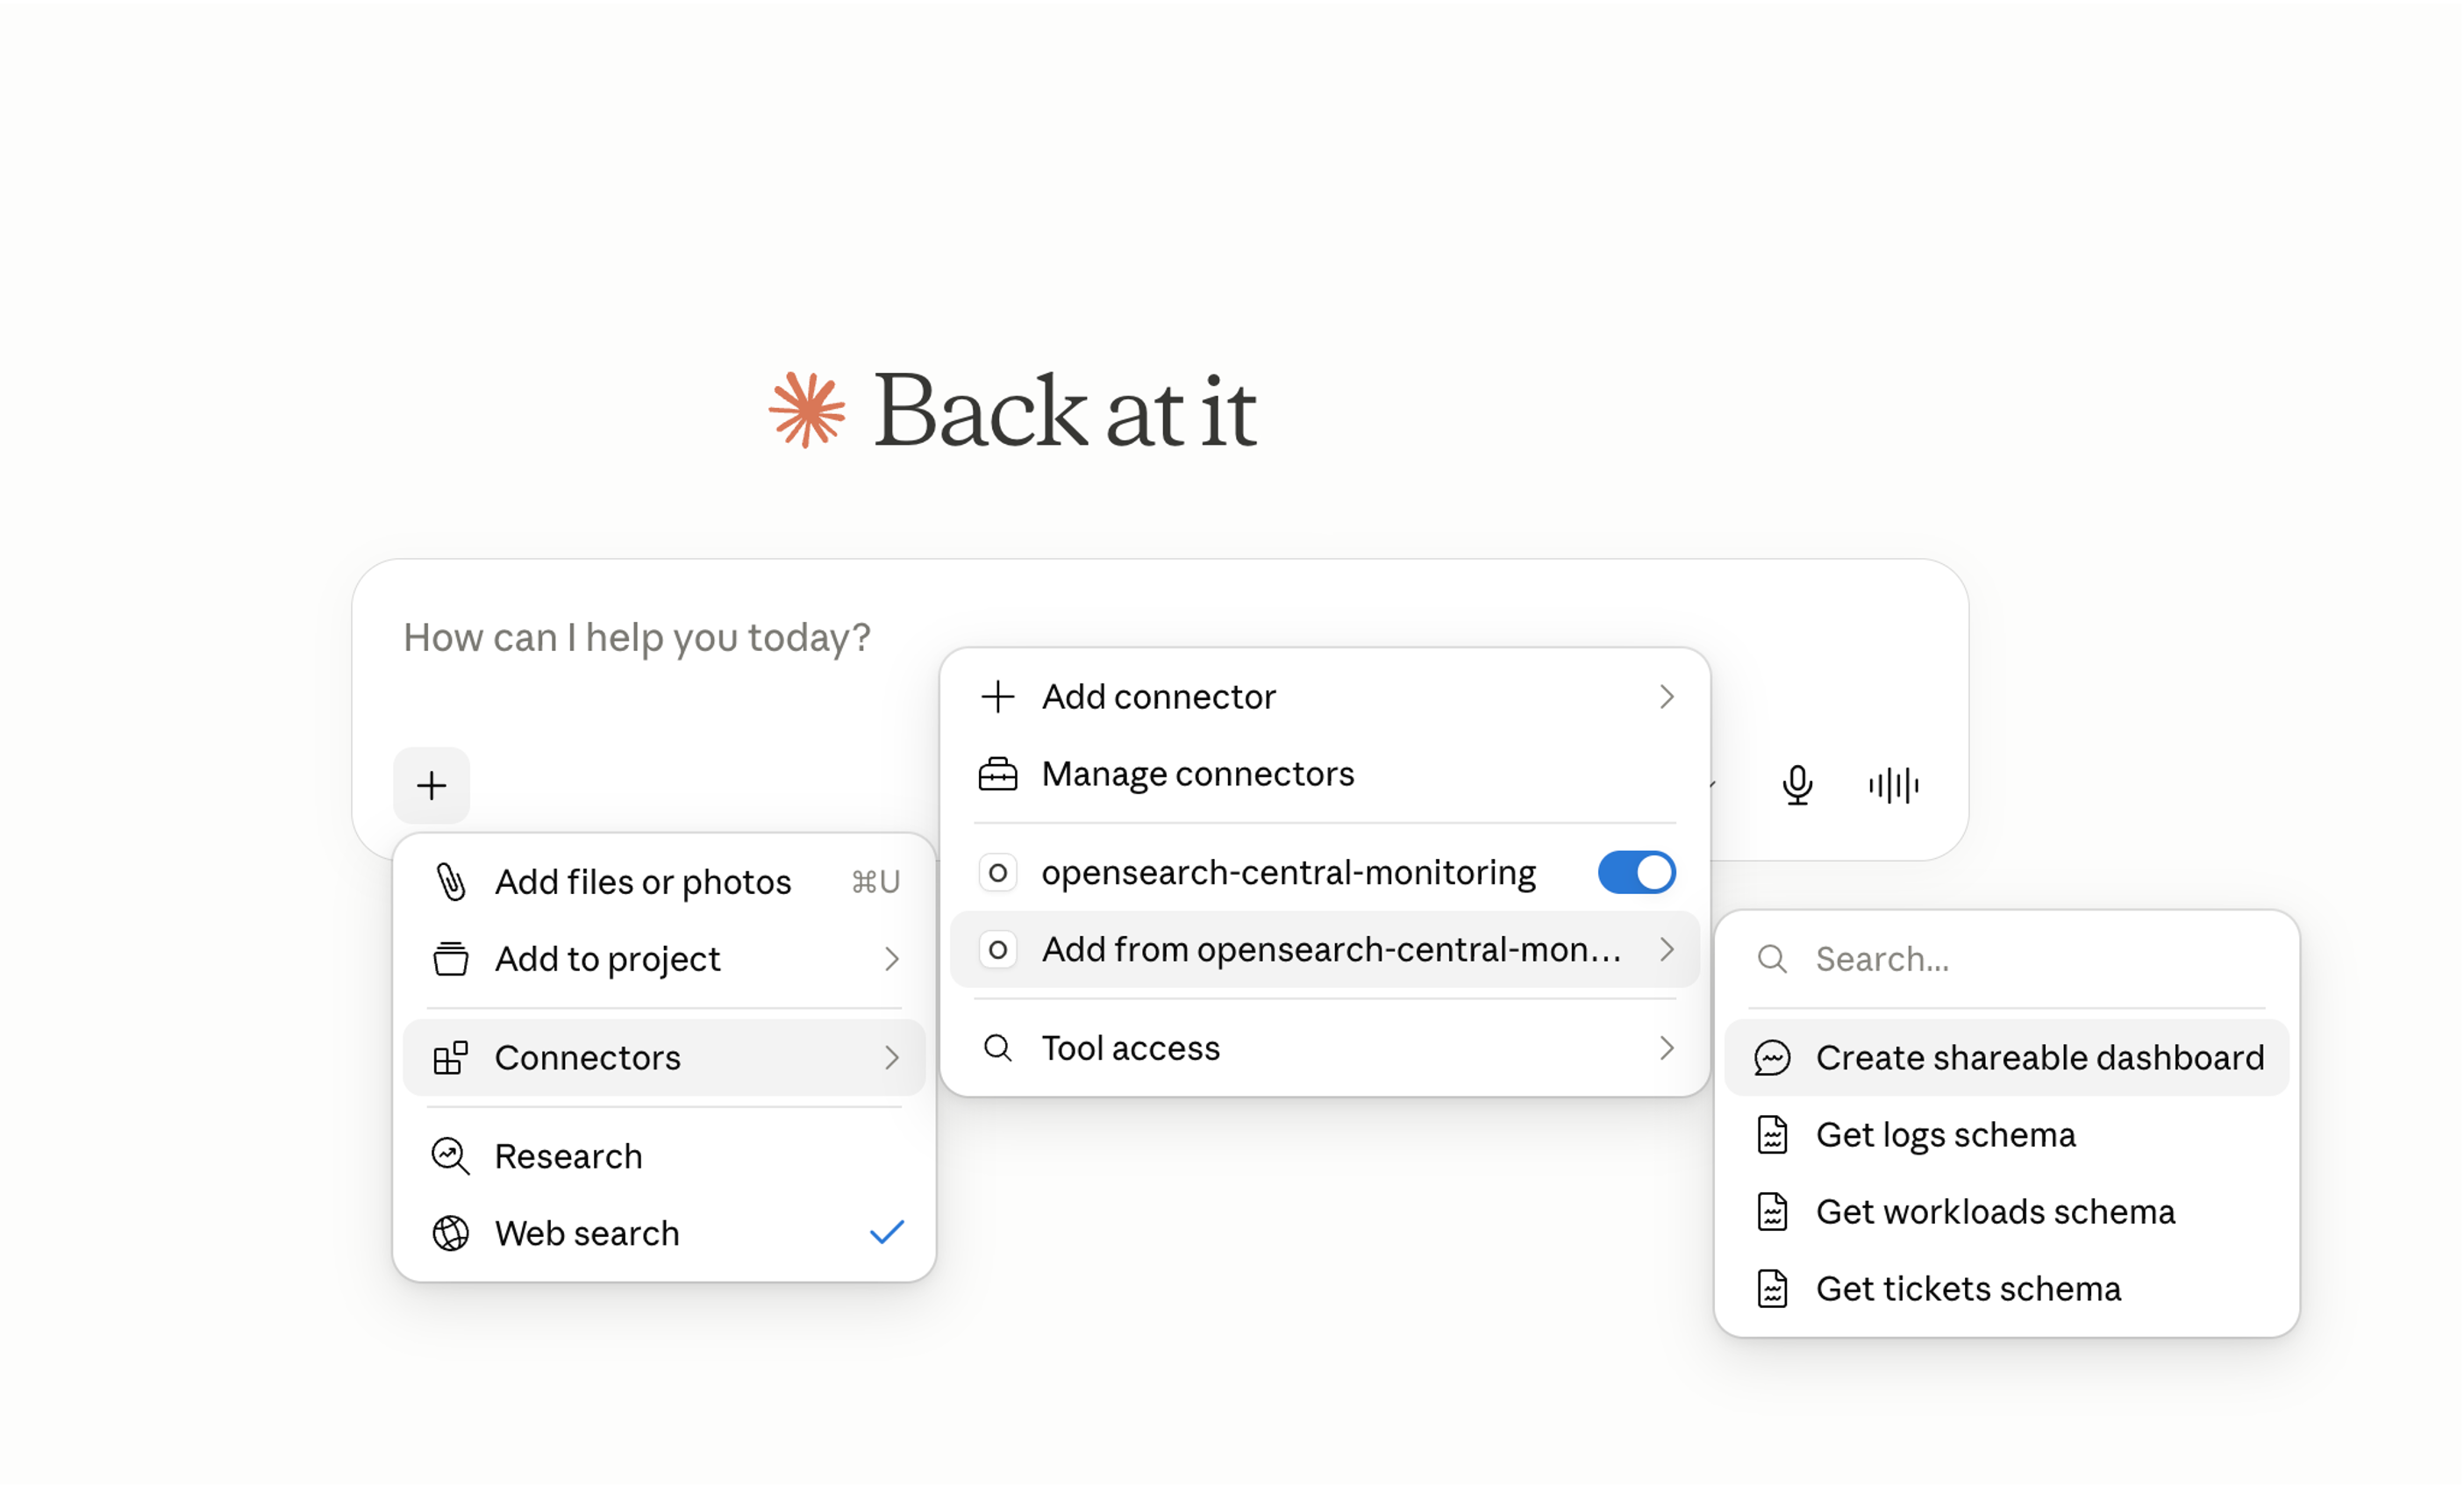
- Other LLMs: Most LLMs support prompt attachments; refer to your LLM's documentation for details.
- Claude: Add the prompt via the attachment menu:
- LLM builds and uploads the dashboard: The LLM converts your static dashboard into a live version and uploads it to Central Monitoring. You'll receive a URL that is immediately accessible and shareable.
What's Included in a Dashboard
Dashboards are self-contained HTML files that typically include:
- Summary tables: Key metrics and breakdowns
- Charts: Line charts, bar charts, or pie charts visualising trends
- Filters: Options to filter for specific data
- Refresh capability: Ability to pull fresh data on demand
- Timestamp: When the dashboard was generated and data last updated
The exact layout depends on the data, the LLM's interpretation of your request, and your specific prompting. You can guide the output by being specific (e.g. "make a bar chart of errors by container name").
Sharing and Access
- Dashboards are hosted on the Central Monitoring website and accessible to anyone with the link and valid CM API credentials.
- Links do not expire automatically - contact the CM team if you need a dashboard removed or URL rotated.
- Dashboards update with live data each time they are loaded and refreshed.
Although API credentials are scoped by Central Monitoring, dashboard links do not expire. Be mindful of who you share them with. Only distribute links to teams that should have access to the underlying data.
Considerations
- Dashboards have static clients - they reflect the clients at the time of dashboard generation, but the metrics for these clients are live.
- Altering dashboards after they have been uploaded will generate a new URL. Ensure the layout and data are appropriate before uploading and sharing.
- The LLM decides the layout and chart types based on the data. For fine-grained control, describe what you want in your prompt. Be specific about the type and layout of each data visualisation.
- Read through Sample Prompts for the MCP to get a better idea of the data available to display.